Performance Index: Mobile takes center stage

The latest MarketLive Performance Index, reporting first quarter results, contains heartening news: revenues continued their double-digit growth streak, climbing 18.7% year over year on traffic gains of 13.9%. Average order size also grew, by 4.4%, suggesting that merchants are finding ways to engage shoppers beyond rock-bottom discounts.

But the report also reveals that these gains, impressive as they are, could have been even more substantial. Merchants are missing a key opportunity to win sales, and that opportunity is mobile.

On the one hand, compared with last year, mobile commerce is growing, with revenue from smartphones up nearly 47% and revenue from tablets up more than 30%. But those large percentage gains mask the fact that mobile revenues are significantly underperforming compared with mobile traffic. Most glaringly, 22% of all eCommerce visits originates on a smartphone, but smartphone purchases account for just 6% of revenue — suggesting merchants have a long way to go to make the touchpoint a viable source of sales.

performance_index_vol24_devices

A deeper dive into the numbers reveals still other challenges:

  • The need for speed on smartphones. With nearly 1 in 2 smartphone visits ending after a single page, merchants are losing a vast number of potential shoppers before they even engage. As one possible remedy, merchants should conduct performance testing on their mobile sites; the majority of consumers now expect load times of less than three seconds, and are disinclined to return to sites that experienced load time problems, according to performance monitoring firm Gomez. And clumsily-implemented responsive design can drag down performance, so merchants contemplating site overhauls should be vigilant.
  • Near-misses on tablets. The add-to-cart rate on tablets is a healthy 11.9% — higher than on desktop sites — but then merchants fail to capitalize on this potential, with the tablet conversion rate lagging at 1.82%. In addition to cart and checkout optimization (more on which below), merchants should also consider the cross-touchpoint habits of their tablet shoppers and cater to those using their devices for research while potentially completing sales elsewhere. “Save cart” and “email cart” options are crucial; merchants should target tablet shoppers with messages incentivizing cross-device access as a benefit of account registration. Additionally, merchants should spotlight options to connect tablet browsers to in-store shopping, such as in-store inventory lookup or the ability to book a personal shopping appointment.
  • Major obstacles on the final steps of the path to purchase. The abandoned cart rate for smartphones is a whopping 83%, and 78% on tablets. While these numbers may partly be driven by shoppers using their devices purely for research, the checkout abandonment percentages are also shockingly high, at 65% for smartphones and 46% for tablets — suggesting that even for shoppers committed to making mobile purchases, the process is far from smooth. Our new whitepaper on path-to-purchase optimization, which we’ll cover in greater depth on the blog soon, contains a compendium of best practices related to mobile checkout we can’t recommend highly enough.

Download the full Performance Index report for more insights into mobile, including “day parting” and mobile performance by vertical. How does your mobile performance stack up?


Guest post: Creating a seamless omnichannel loyalty experience

Alinn Louv of Social Annex Marketing, a member of the MarketLive Agency Network,  contributed this post.

By now, most merchants know that consumers expect to shop across touchpoints. And they also recognize the importance of improving loyalty.   After all, it costs 6-7 times more to acquire a new customer than to retain an existing one. Perhaps that’s why from 2008-2012, loyalty programs grew by 10% each year.

But it’s not enough to award shoppers points for purchases; to meet the needs of the always-connected consumer, merchants must develop an omnichannel loyalty strategy that caters to customers – and entices them to make repeat purchases — wherever they interact with the brand. We’ve come up with a four- step plan to help you develop and implement your loyalty strategy across all channels for a seamless experience for your shoppers.

1. Create a seamless mobile experience. As of last year, more than half of all American adults own a smartphone (). More and more consumers are starting to shop online either through a mobile device or tablet, with the time spent on mobile surpassing time spent on desktops last year (eMarketer).Of those mobile users, nearly three-quarters say it’s important that websites are mobile-friendly (Search Engine Watch). So the first step in moving toward an omnichannel experience is creating a mobile experience. Make your site mobile friendly, with large visuals and simplified navigation to help mobile users quickly find what they are looking for. Integrate loyalty across all channels, including mobile apps, to ensure that customers are receiving points and rewards no matter how they shop.

2. Focus on the customer experience first. Forty percent of consumers buy more from retailers who personalize the shopping experience across channels (Internet Retailer). So merchants should ersonalize the experience at every step possible. Utilize a social login tool in order to gather insights and create a more complete customer profile. Collect data from social network APIs for structured data, such as verified email addresses and birthdates, and unstructured data, such as interests, likes, friends, and more. Use this information to structure your loyalty program. Find out which rewards and perks will resonate with your shoppers and how active your users are on each social network. This information can help build your loyalty program with a focus on Facebook contests or “Pin to Win” Pinterest campaigns.

3. Manage user data. Fifty-four percent of marketers revealed that the biggest inhibitor in establishing a consistent omnichannel customer experience is not having a single view of customers across channels (Retail Systems Research Institute). Gathering data is only half the challenge; still more important is sorting through and organizing the ‘big data’ so merchants can actually derive useful strategies from the information. Standardize all information gathered from a variety of social networks in order to maximize the full potential of personalization. Ensure you have the right infrastructure in place to store massive amounts of data and the ability to access it quickly as well. Organized data makes it easier to scale marketing efforts and target the right customers, at the right time. Leverage this data to inform email marketing efforts, to target new buyers, repeat buyers or inactive buyers. Remind inactive buyers of their expiring rewards to drive them back onsite. Reward repeat buyers with bonus loyalty points or rewards for making their third purchase. Motivate new buyers to sign up for loyalty with large first-time incentives. Keep your loyalty program segmented with staggered rewards to keep your members excited about exclusive access to sales and perks.

4. Engage with customers across all channels. Actively engage with users to foster user generated content, boost SEO, increase referrals, time spent onsite and ultimately conversions. Implement loyalty across all channels and reward users for shopping on each one. Once the channels are in place, engage with users on each channel with social media to boost your loyalty program. Run social contests within social apps or onsite. Interact with users and build a branded community with ratings and reviews. Fully 90% of consumers would recommend a brand after interacting with it via social (IAB, 2013). Furthermore, 64% of Twitter users and 51% of Facebook users are more likely to buy the products of brands they follow online (Business2Community). Reward users for cross promotion to further drive engagement to every channel. Use point incentives to motivate shoppers to download mobile apps, or shop in store for bonus perks.

Leverage customer data and insights to personalize the omnichannel user experience and create an authentic, immersive customer experience that is sure to increase brand loyalty and lifetime customer value. All businesses and customers are unique; loyalty programs should be too.

Performance Index: Lessons from the fourth-quarter crucible

When it comes to seasonal cycles, most merchants acknowledge that the pivotal fourth quarter requires special focus. The latest data from the MarketLive Performance Index demonstrates that the fourth quarter is indeed a crucible. While traffic spikes and conversion rates get a boost, the ruthless mindset of the holiday shopper leaves no room for error — translating into metrics that reveal top areas for improvement in the year ahead.

Overall, the fourth-quarter and annual metrics in the Index report bring good news: merchants achieved year-over-year revenue gains of 26% for the year and 16% for the fourth quarter — beating industry standards by significant margins in both cases. Moreover, those revenue gains were achieved without resorting to race-to-the-bottom discounting, as average order size for both periods also rose year over year. The feat is especially impressive for the  fourth quarter, when merchants saw average order size rise 6.2% despite consumers’ quests for holiday shopping discounts.

MarketLive Performance Index data

But there are performance discrepancies, too. For the year, a significant increase in the add-to-cart, or engagement, rate helped boost revenue gains; once shoppers had placed items in the cart, merchants held the line on “purchase fallout,” with the conversion, abandoned cart, and abandoned checkout rates holding their gain or loss to within roughly 1% compared with 2012.

By contrast, in the fourth quarter, the boost in revenue was tied more directly to the increase in traffic; conversion and add-to-cart rates increased by almost the same percentage, and those gains were undercut by increases in both the abandoned cart rate and the abandoned checkout rate. Breaking down fourth-quarter results even more to focus on the holiday period (November 1 – Jan. 5), the gap widens further, with the both the add-to-cart and conversion rate slipping year over year, in addition to the abandoned cart rate rising.

MarketLive Performance Index holiday data

The numbers from the fourth-quarter crucible suggest one possible pivot point around which to organizing priorities: the all-important add-to-cart rate, which signals intent on the part of shoppers and whose improvement during the other quarters of the year contrasts with the holiday season, when it declined.

Prior to the add-to-cart: develop content to engage shoppers. When it comes to connecting shoppers with relevant products and content and convincing them to add items to the cart, the annual Index data shows that merchants are making marked improvement. But the holiday numbers suggest that they must redouble their efforts if they’re to compete in the battle for holiday shoppers’ engagement. Among the strategies to consider:

  • Service-centric content. As we discussed in our recent post regarding Google’s “Hummingbird” algorithm update, content that focuses on proactively addressing shoppers’ questions about products, service and pricing is more crucial than ever — and needn’t be relegated to the “about us” section. During the holiday season, when shoppers relentlessly research products and hunt for service extras, this content is even more likely to help drive sales.

  • Videos focusing on utility. Product demonstrations, installation tips, and video buying guides add significant value for shoppers, as we discussed previously in our post covering key video content. During the holidays, videos can give shoppers the reassurance they need to commit to purchasing gifts without first touching or trying them.

After the add-to-cart: eliminate roadblocks to purchase — across touchpoints. While merchants maintained a relatively steady state when it came to conversion, cart abandonment and checkout abandonment the rest of the year, the holiday season saw slippage across all three metrics — suggesting that merchants can do more to compel shoppers who’ve already added items to the cart to complete purchases, whether via the touchpoint where they started their shopping journey or not. Merchants should:

  • Use the cart for more than estimated shipping and tax. More than just a cost calculator, the shopping cart should give consumers comprehensive information to support their order, from product upsells to information about product guarantees, returns and exchanges. Free shipping promotions and loyalty club benefits should also be prominent, giving shoppers a bevy of options to successfully complete their transactions. And the ability to print and save cart items for later smooth the path to purchase from online browsing to offline buying.

  • Consider single-page checkout. While we’ve written before about how no single checkout format dominates among the largest of merchants,  prior Performance Index data suggests single-page checkout is becoming more prevalent among specialty and boutique sellers, with 75% of Index transactions taking place via one-page checkout. Furthermore, a streamlined single-page checkout can provide a viable starting point for mobile implementations, which need to be even more frictionless. Whatever the format, merchants should dive deep into their analytics to ferret out checkout problems across touchpoints and devices, and deploy A/B tests to put potential solutions through their paces.

  • Implement alternative payments. We’ve repeatedly addressed the importance of adopting alternative payments, to enable both desktop and mobile purchasing. Of course merchants should take into consideration their target audience and the prevailing standards for their category — for example, BillMeLater is more of a priority to implement for sellers of big-ticket items such as furniture or jewelry than merchants offering fast-fashion T-shirts — but in all likelihood, offering at least one alternative payment option should be a top priority for 2014.

Download the latest Performance Index report for in-depth metrics, including mobile data and KPIs by vertical, and further strategic recommendations. How do your 2013 metrics compare with the MarketLive Index benchmarks, and how are the numbers influencing your 2014 plans?

Performance Index: Holiday season finishes strong

The final results are in from the holiday season, and merchants in the MarketLive Performance Index fared very well indeed. Merchants achieved traffic and revenue gains of more than 15%, and average order size grew a substantial 6.1% — suggesting that deep discounting isn’t always the key to holiday sales growth.

Additionally, merchants in the Index outperformed the industry at large, which notched a 10% sales gain overall, according to measurement firm comScore. The results demonstrate that small- to mid-sized merchants held their own against the mass merchants whose revenues account for the majority of online sales overall.

Holiday sales data from MarketLive

The results also revealed potential areas of improvement for 2014. Both the add-to-cart rate and conversion rate ended the season a tenth of a percentage point lower than in 2013 after lagging in the final days before Christmas and in the first rush of post-season sales. To reverse the trend in 2014, merchants must do more to capitalize on increased traffic if they want to achieve even greater revenue growth. The 3% increase in cart abandonment further eroded the benefit of traffic gains, suggesting merchants must do more to compel shoppers to become brand customers, using whatever touchpoint they prefer.

In our upcoming 2014 trends report, we’ll examine the key initiatives that will help merchants achieve these goals. Among them:

From mobile presence to mobile competence. Our survey of eCommerce sites during the holidays revealed that many merchants have a long way to go when it comes to offering truly effective mobile touchpoints. While most brands have mobile offerings, many are rudimentary efforts that faintly echoed the marketing and merchandising campaigns of the desktop browser Web sites. Instead, regardless of the technical sophistication of their mobile offerings, merchants must customize content and products to take into account shoppers’ situational priorities and present relevant context. MarketLive merchant Armani Exchange presented mobile shoppers with a streamlined experience that included gift guides by price. Email signup was prominently integrated into the presentation so that mobile browsers could sign up to receive special holiday offers, while sharing tools enabled shoppers to post favorite items with ease.

Mobile example from Armani Exchange

Making it personal. Personalization as a concept has existed for years, but the tools now exist for merchants of all sizes to present shoppers with an experience tailored to their preferences and purchase histories and enhanced by individualized customer service. By delivering wholly unique brand interactions, merchants can set their offerings apart from mass discounters and create long-lasting customer relationships. During the holidays, brand manufacturer Carter’s followed up in-store purchases with an invitation to submit a customer review and enter to win a gift card. The message additionally gives shoppers further ways to connect with the brand via social media, and promotes gift card purchase — especially relevant for the holiday season — as well as including store information for the local outlet.

Personalized email example from Carter's

How did your holidays wrap up, and how are the results influencing your priorities for 2014?

Performance Index: merchants well-positioned for final holiday push

The clock is ticking down on the holiday season, and the latest data from the MarketLive Performance Index indicates that merchants are beginning their final push well-positioned to see sustained growth.

In the week of December 9, which began with “Green Monday” (the last Monday in December with at least 10 days before Christmas), Performance Index merchants saw revenue gains of almost 30%, thanks in part to a traffic increase of 23%. Conversion rose by 3.4%, and the average order size outpaced last year’s by 3.5%, again suggesting that merchants are winning sales without resorting to constant bargain-basement pricing.

Combined with the record gains achieved during Black Friday and Cyber Monday, the latest strong results put merchants on track to end the season with substantial sales growth. Cumulative season-to-date revenue is 30% higher than last year, despite the shortened season, and conversion is up more than 6%, while average order size is more than 2% higher than last year.

Holiday data from the MarketLive Performance Index

For many merchants, the deadline is nigh for delivery by Christmas Eve via ground shipping — so the trick for sustaining revenue gains through the end of the season will be to encourage continue spending despite this logistical hurdle. Tactics merchants can adopt include:

Highlighting in-stock items. Merchants should flag items that are in-stock, both for online purchase and for pickup or purchase in stores — enabling shoppers to zero in on the gifts that can make it under the tree in time.

Pairing a collection of in-stock gift finds with a discount on expedited shipping provides online buyers with a compelling reason to complete their purchases immediately. For merchants with physical store outlets, enabling online browsers to view items that qualify for in-store pickup before Christmas at a location near them smooths the online-offline purchase process.

MarketLive merchant Helzberg Diamonds promotes “green truck” items that are guaranteed to arrive on time if purchased by December 23. An icon and shipping estimate are provided on the product page, with a key explaining the fulfillment classification system and displaying estimated delivery dates for each.

Guaranteed delivery promotion from Helzberg

Product page example from Helzberg

Shipping cutoffs explained, from Helzberg

Easing the last-minute store rush. Merchants with physical store locations should move links to the store locator out of the customer service section and into the spotlight. They should additionally bolster standard store-locator information with promotions of relevant online content and services. Gap’s store locator for shoppers browsing the eCommerce site on their desktop or laptop displays not only location-specific hours, but promotes the ability to reserve items online for purchase in-store, along with a curated gift guide showcasing tailored gift picks. On the mobile site, Gap’s store locator — always anchored prominently on the home page — calls out holiday hours in the “Special Hours” section.

Store locator example from Gap

Mobile store locator from Gap

Boosting e-gift card visibility. As discussed in last week’s post, merchants should promote gift card options ubiquitously, in locations that go far beyond the holiday gift guide section. And in the final week, gift cards should receive pride of place on the home page, with merchants highlighting swift delivery via email and flexibility as main selling points. And on the gift card product page, merchants should ensure that options for physical versus virtual gift cards are clearly delineated, so that shoppers wishing to purchase cards for delivery by Christmas are sure to pick the right one.  MarketLive merchant dELiA*s promotes delivery timeframes along with gift card options on its home page. The gift card product page has been updated to reiterate the cutoff dates and delineates the two separate ordering processes for physical versus virtual cards.

Gift card promotion from dELiA*s

Gift card product page from dELiA*s


What last-minute tactics are you employing to keep shoppers engaged through the end of the season?

Performance Index: Cyber Monday week sees major gains

As the short holiday season hits the halfway mark, the news is encouraging for specialty and niche merchants. According to weekly data from the MarketLive Performance Index, Cyber Monday and the week that followed continued the Thanksgiving weekend trend of increased traffic and improved performance metrics, driving overall revenues 32% higher compared with the same week last year.

Furthermore, the data suggests that even amidst heavy discounting, merchants are making strong gains. For one, while traffic for December 2 – December 9 grew by 17%, revenue grew even more substantially, suggesting that individual buyers are purchasing more than last year.  The conversion rate increased by 2.4%. Meantime, the average order size compared with last year held steady, suggesting merchants are successfully wooing shoppers without necessarily discounting steeply.

MarketLive Performance Index data

The only performance challenge merchants face is with the add-to-cart rate, which plummeted nearly a full percentage point, by more than 8%, compared with the prior week. With offers flying fast and furious, shoppers are comparison shopping and waiting for the right deal to entice them to finalize purchases. While overall the add-to-cart rate for the season is up by 11.3%, merchants should redouble their efforts to convert shoppers to buyers. Among the quick tactics to try:

Promote limited-time offers beyond the obvious spots.  Merchants should include notices about free shipping offers or price discounts in the cart, whether via a global banner or a promotional fill slot. But even before shoppers reach that milestone on the path to purchase, merchants should flag promotions and direct shoppers to relevant information. Locations to consider include:

  • The drop-down global cart. As we’ve noted previously, graphics or images in motion are more likely to capture our attention than static site content, so including promotions in this automated display stand a better chance of being seen.

  • In secondary navigation. When used, a left-hand column usually exposes the depth of products on offer, whether via  a detailed sub-category list or by using a guided-navigation-style list of attributes shoppers can access to resolve problems. But it’s also an opportunity to reiterate the latest promotion and its end date, so that shoppers can access details from wherever on the site they roam.

  • On product pages. With consumers increasingly accessing eCommerce sites via interior pages after being directed there from search engines, it’s crucial for merchants to feature deals right alongside product content.MarketLive merchant Armani Exchange highlights current discounts in red on the product page, calling out the free shipping thresholds and “deal of the week” merchandise.

Promotion example from Armani Exchange

Fine-tune triggered emails. As we’ve reported previously, nearly three-quarters of merchants don’t yet have a triggered email program in place to attempt to recapture sales after consumers leave the site.  While it’s too late to institute such a program from scratch right now, merchants with existing abandoned-cart triggered emails should consider revamping them slightly. The messages should include:

  • Plenty of product content. Merchants should incorporate more than just the image of the product the shopper left in the cart, but should take the opportunity to provide a longer product story. A comprehensive description, paired with how-to videos demonstrating usage and even a buying guide matching the product category, can win over hesitant shoppers by helping them envision how the product might fit or feel.

  • Abundant customer service links. Merchants should put contact information front and center in cart-recovery messages, with links to product guarantees and delivery timelines that help shoppers what they need.

  • Social connectors. The ability to connect to communities of followers on social outposts may help shoppers find lifestyle content that convinces them to commit to a purchase from the brand.

Clothier French Connection puts it all together in its cart abandonment email. In addition to displaying a picture of the abandoned item and the means to link directly to checkout, the message includes a sizable section describing customer service and displaying contact information. A series of links at the bottom of the message directs shoppers to connect via social media.
Abandoned cart email from French Connection

What tactics are you using to drive continued engagement through the holiday season?

Performance Index: merchants riding wave of growth into holidays

As the high-stakes holiday season kicks into overdrive, the latest data from the MarketLive Performance Index suggests merchants are well-positioned to see double-digit revenue gains.

In the third quarter, merchants saw improvement across a wide range of performance metrics. Year-over-year visits increased more than 15%, and with the add-to-cart rate and conversion rate both seeing modest gains, overall revenue rose 17%. The average order size also nudged upwards by 1.5%, suggesting merchants needn’t adopt bargain-basement pricing strategies to win new business.

Among the key findings:

Mobile sales — from both smartphones and tablets — are growing. Mobile continues to play an ever-more-crucial role in the shopping experience. More than a third of all traffic originates with smartphones or tablets, driving 17% of total revenue. While smartphone performance overall lags tablet metrics, smartphone revenue has jumped by an impressive 65% year over year to 4% of all online sales — a faster growth rate than tablet sales, which increased 39%, to 13% of the total.

Statistics from the MarketLive Performance Index

The data suggests that merchants need to account for both device types as they plan their mobile strategies for 2014. Considerations include:

  • How to “flip” to mobile-first email. By some counts, more than half of email is now read via mobile devices, which means that merchants must tailor their messaging for maximum mobile utility. Designing appropriately-sized “tap targets”, streamlining Subject: lines and ensuring video and animation elements render properly on mobile platforms should all be on the checklist.

Social’s role is small — but potentially important. There’s no denying that compared with mobile, social media affords merchants a less direct path to revenues. Index data reveals that while just 1 to 2% of traffic and revenue can be directly attributable to social media, even those small percentages represent substantial increases from the prior year. Social traffic grew 29%, while social revenue skyrocketed by 77% — suggesting that merchants deploying savvy social  strategies will increasingly reap ROI rewards. In particular, merchants should:

  • Give social followers a holiday boost. To increase potential engagement and word-of-mouth buzz, merchants should offer social shoppers the means to interact with the brand around holiday promotions — whether by running a holiday-themed contest,  offering them a sneak peek at Black Friday discounts or even giving them the opportunity to vote on what those discounts will be in the first place.

  • Entice brand “newbies.” Index data reveals that nearly three quarters of traffic to merchant eCommerce sites from social networks derives from first-time visitors, compared with the overall average of 61% first-time visitors. To engage these would-be brand enthusiasts, merchants should take pains to communicate their brand’s unique identity on social outposts. They should prominently post brand-defining product guarantees, return policies and shipping offers, and use social promotions to showcase the breadth and depth of their product offering. Lifestyle content that appeals to target audiences demonstrates the brand’s expertise, as with MarketLive merchant Stila Cosmetics, whose Pinterest profile demonstrates a passion for trend-setting fashion via boards displaying products used during New York Fashion Week and “We <3 Fashion,” a board of favorite apparel and makeup picks from around the Internet.

Social media example from Stila

Download the full Index report for industry-specific metrics and further data. What metrics will you be watching this holiday season?

How to measure the ROI of video

We’ve been discussing video all year long, and for good reason. More than 86% of Internet consumers watched a video in the past month, according to measurement firm comScore; YouTube is the world’s second-largest search engine; and consumers report that video content boosts confidence in purchases. In short, video is now essential to a merchant’s overall content offering.

The upcoming holiday season provides a ripe opportunity for merchants to prove the worth of their video investment — which means getting serious about video metrics. While many merchants have begun collecting analytics data on video performance, it’s time to move beyond simply counting video views to present a more nuanced picture of how videos impact a brand’s overall reputation and bottom line. The top three areas for analysis:

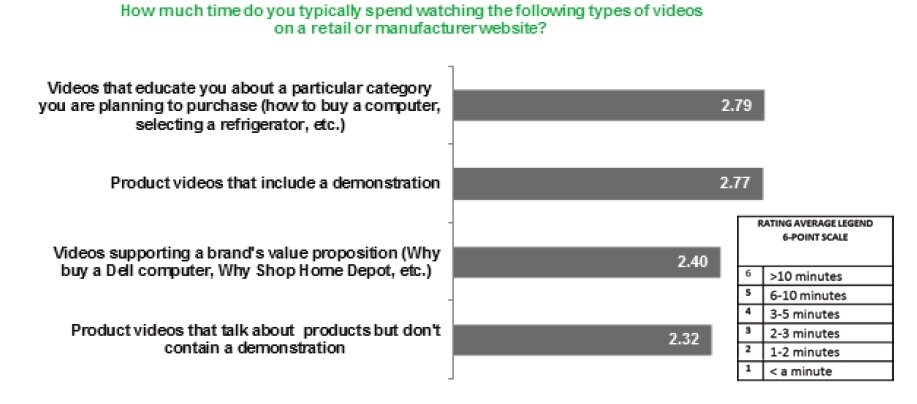
Watch time, over time. Rather than focusing on the raw number of views a video receives, merchants should dive deeper to analyze the watch time — that is, how much of the video’s content consumers actually view. While merchants may believe shorter clips are better, research from the E-Tailing Group and Invodo reveals that consumers typically watch between one and three minutes of videos related to product purchases so merchants should experiment with videos of varying lengths and use analytics to uncover what content resonates most with their target audience. Even if the number of views is relatively small, a solid watch time indicates that the video is successfully meeting the needs of its audience and helping boost the brand.

Data on video viewership from E-Tailing Group

Merchants should also track video performance over time and note any changes in viewership and watch time. While an initial video launch might draw a burst of buzz, in the course of a year a video earns fully two-thirds its views from the fourth week onward, according to data from video marketer Pixability. Tracking watch time over a longer time period can reveal shifts in viewing behavior that extend the utility of content. For example, an in-depth installation video may have a low watch time within the first month of its posting, but, if integrated into a post-purchase transactional email, may garner longer views for customers who go on to buy and use the product.

Engagement: Subscribes, comments and shares. While tracking watch time is an important first step toward understanding consumer engagement with video content, it’s still ultimately about passive interaction; after all, a video view with a long watch time may reflect compelling content, or may be due to the user opening another browser window and moving on to another activity as the video continues to play. Merchants should additionally gauge whether videos spur consumers to act, not just watch, by tracking:

  • the number of subscribers their video channels have. Consumers willing to receive notifications when new videos from brands are posted are likely to be highly receptive to purchase. Merchants should use watch time data to place prompts to subscribe within video content before the majority of users drop off.

  • the number of comments videos receive. While the number of likes/dislikes/favorites videos garner is an indication of split-second reactions, the number of comments is a better indicator of the content’s ability to engage shoppers on a deeper level and prompt them to respond in their own words.

  • the number of social media shares videos garner. Video content is a potentially powerful generator of word-of-mouth buzz, so merchants should track how often their videos pass from followers to their friends.

Revenue. Tying revenue to video has been an elusive goal for merchants, but as merchants have the opportunity to forge ever tighter links between video content and commerce and as analytics tools’ attribution models become more sophisticated, gauging contribution to revenue is more accurate than ever. Methods to consider:

  • Direct links from video content. As discussed in our prior post, it’s now possible to embed product and even purchase links directly within video content — so merchants have the opportunity to take video viewers to custom landing pages that smooth the path to purchase or even directly to the cart and then to track the results of those visits.

  • Effectiveness of product pages with video. With the product page as an anchor for key video content, merchants can delve deep into the effectiveness of video in compelling shoppers to add items to the cart. Comparing the outcomes of visits to a product page that include a video view with those that do not helps quantify whether or not video content is persuasive; marrying that data with watch times to see if longer views result in increased revenues adds another dimension to the data.

How are you measuring the effectiveness of video content?

The mobile analytics to track now for holiday success

Mobile is poised to have a huge impact on the upcoming holiday season. By some estimates, in 2012 fully a third of traffic to merchant web sites was from mobile devices, while on the biggest shopping day of the year — Cyber Monday — fully 13% of online revenue was from mobile devices, a 96% increase compared with 2011. With more tablet and smartphone users shopping on their devices with each passing month, it’s no wonder many merchants have prioritized mobile as a key offering to encourage year-end sales.

Given the central importance of mobile, new research about the use of mobile analytics comes as a shock. More than 40% of retailers have failed to identify mobile KPIs, according to technology researcher Forrester — and the same percentage lack any kind of mobile analytics solution.

Merchants should remedy this situation immediately if they want to attain holiday success — not only so they can establish a baseline against which to compare mobile activity during the season itself, but so they can analyze current activity and tweak offerings prior to the peak sales period. Among the metrics to track:

Cart and checkout fallout by device. Among the retailers who do use mobile analytics, revenue and conversion are among the top three metrics they track, along with traffic. But given that smartphone conversion is at an abysmal 1%, and tablet conversion still lags behind the purchase rate of browsers on desktop and laptop computers, it’s crucial for merchants to conduct a “deep dive” and understand where shoppers on various devices encounter stumbling blocks on the mobile path to purchase.

Customer service metrics. Another disappointing tidbit from the Forrester data: less than 40% of retailers track customer satisfaction with mobile offerings.

mobilemetrics_forrester

But with stellar customer service an important brand differentiator, merchants should attempt to gauge satisfaction with offerings on every device — not just the main eCommerce site. Tactics for monitoring mobile satisfaction include:

  • Use of “click to call” specifically for the customer service phone number. Connect mobile data with referral data from the call center to get a complete picture of how often mobile shoppers resort to speaking with representatives in person, what triggers the calls, and how successful those interactions are.

  • Exit pages within customer service content. If particular pages are causing shoppers to abandon the mobile site, merchants should consider revamping and/or repositioning access to them for an improved experience.

  • The outcome of mobile site search queries related to customer service. Popular terms should yield plenty of results, including shortcuts to commonly-sought information such as store locations and shipping policies.

Cross-touchpoint synchronicity. Merchants should find ways to go beyond simply monitoring traffic to the store locator to gain a deeper understanding of how shoppers move from mobile devices to desktop or laptop browsing to physical stores and back again. Metrics to consider:

  • Signups for in-store classes or events. Merchants should track any potential conversions related to activites in physical outlets, thereby gaining a deeper understanding of the content shoppers seek.

  • Scans of QR codes in-store. Giving shoppers the ability to access further product and service content than is available on store displays is a distinct advantage of mobile, and merchants should make such activity trackable by using QR codes that connect to custom landing pages.

  • Scans of mobile coupons. By tracking the number of mobile coupon redemptions and connecting that data to order size and product information, merchants can compare performance with traditional paper coupons and refine offers accordingly.

  • Click-to-call specifically to store locations. As with customer service calls, merchants should identify the triggers for calls to physical store locations to gauge whether additional location-specific content is needed on the mobile site.

  • Cross-touchpoint activity by loyalty club users. While connecting the in-store and online behavior of casual shoppers is difficult, merchants who offer a loyalty or free shipping club have a better chance of tying together disparate data points.

What mobile metrics are you tracking, and how have they impacted your mobile strategy?

Performance Index update: The social imperative

In last week’s post, we discussed the need for merchants to fine-tune their holiday strategies now to set the stage for success during the crucial final weeks of the year. Based on new data from the MarketLive Performance Index, it appears that merchants are in a good position to generate sales growth.

Second-quarter Index data shows strong year-over-year revenue growth of more than 15%. Traffic is on the upswing, surging 8.53% compared with a year ago, and merchants took advantage of the opportunity, improving conversion by nearly 5%, abandonment by just over 3%, and the add-to-cart or engagement rate by 2.5%.

But the “1-and-out” or bounce rate continued to lag, rising for the sixth straight quarter and signaling that merchants stand to reap even greater gains if they can better match the right products with their targeted audience.

Social media data from the MarketLive Performance Index One key area of weakness continues to be social networking. The percentage of shoppers linking to eCommerce sites from social networks has stayed nearly flat from a year ago – rising to 1.04% this year compared with 1.00% in Q2 of 2011. Moreover, retailers and brand manufacturers are flagging in their efforts to drive social traffic, while catalogers – the weakest segment in this regard – are improving, but can still only attribute less than a percent of their visits to social networks. The stagnant performance suggests merchants must continue to find new ways to engage this audience, which is a potential source of not only lucrative sales but also powerful word-of-mouth clout during the holidays.

In response to the Index numbers, we suggest adding social as a holiday priority. Consider these tactics:

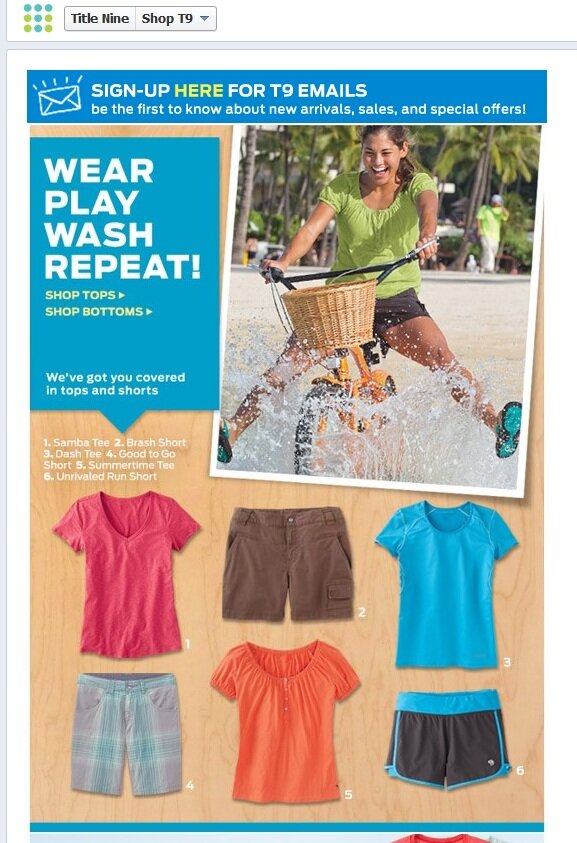
Give Facebook followers the ability to browse and buy. Unless you’ve enabled a Facebook shopping cart which allows followers to make purchases without leaving the social environment, your fan page should actively be directing traffic to products and categories on the eCommerce site. Consider creating displays targeted to the social audience that showcase the latest seasonal items, sought-after gifts and exclusive deals — and use deep links to the eCommerce site so that shoppers connect directly with the relevant content. Women’s recreational clothier Title Nine features a “Shop T9” link at the top of its page, and offers followers a selection of popular tops and shorts for summer. Shoppers who click on a product image are taken directly to the product page on the eCommerce site.

Facebook shopping example from Title Nine

Facebook shopping example from Title Nine


Develop a social discount strategy. Social followers are on the lookout for deals, so develop a plan for offering exclusive discounts that synchs with your other campaigns. The Twitter audience is especially deal-hungry; according to data from eMarketer, 48% of Twitter users who follow brands do so expressly to receive discounts.

Plan a Pinterest contest. As noted in an earlier post, Pinterest is now the third-largest social network. During the holiday season, look for this image-rich site to be full of wish list pinboards; encourage shoppers to showcase your products by running a “win your wish list” or other sweepstakes contest — and cross-promote it via email and other social networks. Last year, Land’s End invited Facebook users to create Pinterest boards featuring its products, and picked 10 winners to receive  $250 gift cards.
Pinterest example from Lands End

Download the full Index report to view more holiday tips plus data by industry and business type. Meantime, what social strategies are you planning for the holiday season?

WordPress SEO fine-tune by Meta SEO Pack from Poradnik Webmastera